Applets:Physical Signal & Analytic Signal: Unterschied zwischen den Versionen
Tasnad (Diskussion | Beiträge) |
Tasnad (Diskussion | Beiträge) K (Tasnad verschob die Seite Physical Signal & Analytical Signal nach Physical Signal & Analytic Signal) |
(kein Unterschied)
| |
Version vom 24. August 2018, 12:36 Uhr
Inhaltsverzeichnis
Applet Description
This applet shows the relationship between the physical bandpass signal $x(t)$ and the associated analytic signal $x_+(t)$. It is assumed that the bandpass signal $x(t)$ has a frequency-discrete spectrum $X(f)$:
- $$x(t) = x_{\rm U}(t) + x_{\rm T}(t) + x_{\rm O}(t) = A_{\rm U}\cdot \cos\left(2\pi f_{\rm U}\cdot t- \varphi_{\rm U}\right)+A_{\rm T}\cdot \cos\left(2\pi f_{\rm T}\cdot t- \varphi_{\rm T}\right)+A_{\rm O}\cdot \cos\left(2\pi f_{\rm O}\cdot t- \varphi_{\rm O}\right). $$
The physical signal $x(t)$ is thus composed of three harmonic oscillations, a constellation that can be found, for example, in the Double-sideband Amplitude Modulation
- of the message signal $x_{\rm N}(t) = A_{\rm N}\cdot \cos\left(2\pi f_{\rm N}\cdot t- \varphi_{\rm N}\right)$ ⇒ in German: Nachrichtensignal
- with the carrier signal $x_{\rm T}(t) = A_{\rm T}\cdot \cos\left(2\pi f_{\rm T}\cdot t - \varphi_{\rm T}\right)$ ⇒ in German: Trägersignal.
The nomenclature is also adapted to this case:
- $x_{\rm O}(t)$ denotes the „upper sideband” (in German: Oberes Seitenband) with the amplitude $A_{\rm O}= A_{\rm N}/2$, the frequency $f_{\rm O} = f_{\rm T} + f_{\rm N}$ and the phase $\varphi_{\rm O} = \varphi_{\rm T} + \varphi_{\rm N}$.
- Similarly, for the „lower sideband” (in German: Unteres Seitenband) $x_{\rm U}(t)$ with $f_{\rm U} = f_{\rm T} - f_{\rm N}$, $A_{\rm U}= A_{\rm O}$ and $\varphi_{\rm U} = -\varphi_{\rm O}$.
The associated analytic signal is:
- $$x_+(t) = x_{\rm U+}(t) + x_{\rm T+}(t) + x_{\rm O+}(t) = A_{\rm U}\cdot {\rm e}^{\hspace{0.05cm}{\rm j}\hspace{0.05cm}\cdot \hspace{0.05cm}(2\pi \hspace{0.05cm}\cdot \hspace{0.05cm}f_{\rm U}\hspace{0.05cm}\cdot \hspace{0.05cm}t- \varphi_{\rm U})} \hspace{0.1cm}+ \hspace{0.1cm}A_{\rm T}\cdot {\rm e}^{\hspace{0.05cm}{\rm j}\hspace{0.05cm}\cdot \hspace{0.05cm}(2\pi \hspace{0.05cm}\cdot \hspace{0.05cm}f_{\rm T}\hspace{0.05cm}\cdot \hspace{0.05cm}t- \varphi_{\rm T})} \hspace{0.1cm}+\hspace{0.1cm} A_{\rm O}\cdot {\rm e}^{\hspace{0.05cm}{\rm j}\hspace{0.05cm}\cdot \hspace{0.05cm}(2\pi \hspace{0.05cm}\cdot \hspace{0.05cm}f_{\rm O}\hspace{0.05cm}\cdot \hspace{0.05cm}t- \varphi_{\rm O})}. $$
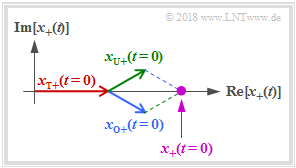
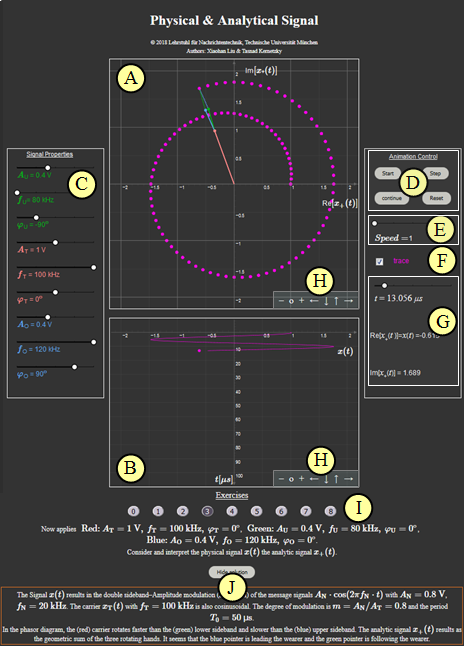
The program displays $x_+(t)$ as the vectorial sum of three rotating pointers (all with counterclockwise) as a violet dot (see figure for start time $t=0$):
- The (red) pointer of the carrier $x_{\rm T+}(t)$ with length $A_{\rm T}$ and zero phase position $\varphi_{\rm T} = 0$ rotates at constant angular velocity $2\pi \hspace{0.05cm}\cdot \hspace{0.05cm}f_{\rm T}$ (one revolution in time $1/f_{\rm T})$.
- The (blue) pointer of the upper sideband $x_{\rm O+}(t)$ with length $A_{\rm O}$ and zero phase position $\varphi_{\rm O}$ rotates at the angular velocity $2\pi \hspace{0.05cm}\cdot \hspace{0.05cm}f_{\rm O}$, which is slightly faster than $x_{\rm T+}(t)$.
- The (green) pointer of the lower sideband $x_{\rm U+}(t)$ with length $A_{\rm U}$ and zero phase position $\varphi_{\rm U}$ rotates at the angular velocity $2\pi \hspace{0.05cm}\cdot \hspace{0.05cm}f_{\rm U}$, which is slightly slower than $x_{\rm T+}(t)$.
The time trace of $x_+(t)$ is also referred to below as Pointer Diagram. The relationship between the physical bandpass signal $x(t)$ and the associated analytic signal $x_+(t)$ is:
- $$x(t) = {\rm Re}\big [x_+(t)\big ].$$
Note: In the figure $\varphi_{\rm O} = +30^\circ$. This leads to the angle with respect to the coordinate system at $t=0$: $\phi_{\rm O}=-\varphi_{\rm O}=-30^\circ$. Similarly, the null phase angle $\varphi_{\rm U}=-30^\circ$ of the lower sideband leads to the phase angle to be considered in the complex plane: $\phi_{\rm U}=+30^\circ$.
Theoretical Background
Description of Bandpass Signals
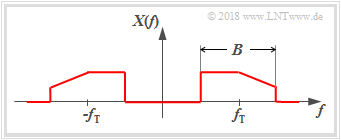
We consider bandpass signals $x(t)$ with the property that their spectra $X(f)$ are not in the range around the frequency $f=0$, but around a carrier frequency $f_{\rm T}$. In most cases it can also be assumed that the bandwidth is $B \ll f_{\rm T}$.
The figure shows such a bandpass spectrum $X(f)$. Assuming that the associated $x(t)$ is a physical signal and thus real, the spectral function $X(f)$ has a symmetry with respect to the frequency $f = 0$, if $x(t)$ is an even function ⇒ $x(-t)=x(t)$, $X(f)$ is real and even.
Besides the physical signal $x(t)\ \circ\!\!-\!\!\!-\!\!\!-\!\!\bullet\, \ X(f)$, one can also use the following descriptions of bandpass signals:
- the analytic signal $x_+(t)\ \circ\!\!-\!\!\!-\!\!\!-\!\!\bullet\, \ X_+(f)$, see next page,
- the equivalent lowpass signal (in German: äquivalentes Tief Pass–Signal) $x_{\rm TP}(t)\ \circ\!\!-\!\!\!-\!\!\!-\!\!\bullet\, \ X_{\rm TP}(f)$,
see Applet Physical Signal & Equivalent Lowpass signal.
Analytical Signal – Frequency Domain
The analytic signal $x_+(t)$ belonging to the physical signal $x(t)$ is the time function whose spectrum fulfills the following property:
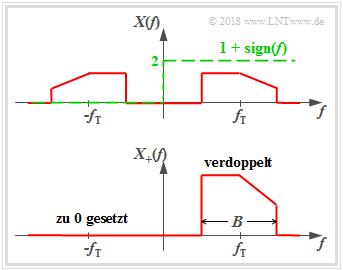
- $$X_+(f)=\big[1+{\rm sign}(f)\big] \cdot X(f) = \left\{ {2 \cdot X(f) \; \hspace{0.2cm}\rm for\hspace{0.2cm} {\it f} > 0, \atop {\,\,\,\, \rm 0 \; \hspace{0.9cm}\rm for\hspace{0.2cm} {\it f} < 0.} }\right.$$
The signum function is for positive values of $f$ equal to $+1$ and for negative $f$ values equal to $-1$.
- The (double-sided) limit returns $\sign(0)=0$.
- The index „+” should make it clear that $X_+(f)$ only has parts at positive frequencies.
From the graph you can see the calculation rule for $X_+(f)$:
The actual bandpass spectrum $X(f)$ becomes
- doubled at the positive frequencies, and
- set to zero at the negative frequencies.
Due to the asymmetry of $X_+(f)$ with respect to the frequency $f=0$, it can already be said that the time function $x_+(t)$ except for a trivial special case $x_+(t)=0 \ \circ\!\!-\!\!\!-\!\!\!-\!\!\bullet\,X_+(f)=0$ is always complex.
Analytical Signal – Time Domain
At this point, it is necessary to briefly discuss another spectral transformation.
$\text{Definition:}$ For the Hilbert transform $ {\rm H}\left\{x(t)\right\}$ of a time function $x(t)$ we have:
- $$y(t) = {\rm H}\left\{x(t)\right\} = \frac{1}{ {\rm \pi} } \cdot \hspace{0.03cm}\int_{-\infty}^{+\infty}\frac{x(\tau)}{ {t - \tau} }\hspace{0.15cm} {\rm d}\tau.$$
This particular integral is not solvable in a simple, conventional way, but must be evaluated using the Cauchy principal value theorem.
Accordingly, in the frequency domain:
- $$Y(f) = {\rm -j \cdot sign}(f) \cdot X(f) \hspace{0.05cm} .$$
The above result can be summarized with this definition as follows:
- The analytic signal $x_+(t)$ is obtained from the physical bandpass signal $x(t)$ by adding an imaginary part to $x(t)$ according to the Hilbert transform:
- $$x_+(t) = x(t)+{\rm j} \cdot {\rm H}\left\{x(t)\right\} .$$
- $\text{H}\{x(t)\}$ disappears only for the case $x(t) = \rm const.$ ⇒ the same signal. For all other signal forms, the analytic signal $x_+(t)$ is complex.
- From the analytic signal $x_+(t)$, the physical bandpass signal can be easily determined by the following operation:
- $$x(t) = {\rm Re}\big[x_+(t)\big] .$$
$\text{Example 1:}$ The principle of the Hilbert transformation should be further clarified by the following graphic:
- After the left representation $\rm(A)$ one gets from the physical signal $x(t)$ to the analytic signal $x_+(t)$, by adding an imaginary part ${\rm j} \cdot y(t)$.
- Here $y(t) = {\rm H}\left\{x(t)\right\}$ is a real time function that can be indicated in the spectral domain by multiplying the spectrum $X(f)$ with ${\rm - j} \cdot \sign(f)$.
The right representation $\rm(B)$ is equivalent to $\rm(A)$. Now $x_+(t) = x(t) + z(t)$ stand with the purely imaginary function $z(t)$. A comparison of the two figures shows that in fact $z(t) = {\rm j} \cdot y(t)$.
Representation of the Harmonic Oscillation as an Analytical Signal
The spectral function $X(f)$ of a harmonic oscillation $x(t) = A\cdot\text{cos}(2\pi f_{\rm T}\cdot t - \varphi)$ is known to consist of two Dirac functions at the frequencies
- $+f_{\rm T}$ with the complex weight $A/2 \cdot \text{e}^{-\text{j}\hspace{0.05cm}\varphi}$,
- $-f_{\rm T}$ with the complex weight $A/2 \cdot \text{e}^{+\text{j}\hspace{0.05cm}\varphi}$.
Thus, the spectrum of the analytic signal (that is, without the Dirac function at the frequency $f =-f_{\rm T}$, but doubling at $f =+f_{\rm T}$):
- $$X_+(f) = A \cdot {\rm e}^{-{\rm j} \hspace{0.05cm}\varphi}\cdot\delta (f - f_{\rm T}) .$$
The associated time function is obtained by applying the Displacement Law:
- $$x_+(t) = x_{\rm U+}(t) + x_{\rm T+}(t) + x_{\rm O+}(t) = A_{\rm U}\cdot {\rm e}^{\hspace{0.05cm}{\rm j}\hspace{0.05cm}\cdot \hspace{0.05cm}(2\pi \hspace{0.05cm}\cdot \hspace{0.05cm}f_{\rm U}\hspace{0.05cm}\cdot \hspace{0.05cm}t- \varphi_{\rm U})} \hspace{0.1cm}+ \hspace{0.1cm}A_{\rm T}\cdot {\rm e}^{\hspace{0.05cm}{\rm j}\hspace{0.05cm}\cdot \hspace{0.05cm}(2\pi \hspace{0.05cm}\cdot \hspace{0.05cm}f_{\rm T}\hspace{0.05cm}\cdot \hspace{0.05cm}t- \varphi_{\rm T})} \hspace{0.1cm}+\hspace{0.1cm} A_{\rm O}\cdot {\rm e}^{\hspace{0.05cm}{\rm j}\hspace{0.05cm}\cdot \hspace{0.05cm}(2\pi \hspace{0.05cm}\cdot \hspace{0.05cm}f_{\rm O}\hspace{0.05cm}\cdot \hspace{0.05cm}t- \varphi_{\rm O})}. $$
This equation describes a pointer rotating at constant angular velocity $\omega_{\rm T} = 2\pi f_{\rm T}$.
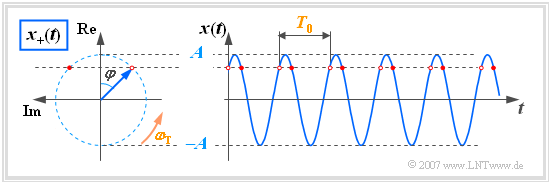
$\text{Example 2:}$ Here the coordinate system is rotated by $90^\circ$ (real part up, imaginary part to the left) contrary to the usual representation.
Based on this graphic, the following statements are possible:
- At time $t = 0$, the pointer of length $A$ (signal amplitude) lies with the angle $-\varphi$ in the complex plane. In the example shown, $\varphi=45^\circ$.
- For times $t>0$, the constant angular velocity vector $\omega_{\rm T}$ rotates in a mathematically positive direction, that is, counterclockwise.
- The tip of the pointer is thus always on a circle with radius $A$ and needs exactly the time $T_0$, i.e. the period of the harmonic oscillation $x(t)$ for one revolution.
- The projection of the analytic signal $x_+(t)$ on the real axis, marked by red dots, gives the instantaneous values of $x(t)$.
Analytical Signal Representation of a Sum of Three Harmonic Oscillations
In our applet, we always assume a set of three rotating pointers. The physical signal is:
- $$x(t) = x_{\rm U}(t) + x_{\rm T}(t) + x_{\rm O}(t) = A_{\rm U}\cdot \cos\left(2\pi f_{\rm U}\cdot t- \varphi_{\rm U}\right)+A_{\rm T}\cdot \cos\left(2\pi f_{\rm T}\cdot t- \varphi_{\rm T}\right)+A_{\rm O}\cdot \cos\left(2\pi f_{\rm O}\cdot t- \varphi_{\rm O}\right). $$
- Each of the three harmonic oscillations $x_{\rm T}(t)$, $x_{\rm U}(t)$ and $x_{\rm O}(t)$ is represented by an amplitude $(A)$, a frequency $(f)$ and a phase value $(\varphi)$.
- The indices are based on the Double-sideband Amplitude Modulation method. „T” stands for „carrier”, „U” for „lower sideband” and „O” for „upper Sideband”.
- Accordingly, $f_{\rm U} < f_{\rm T}$ and $f_{\rm O} > f_{\rm T}$. There are no restrictions for the amplitudes and phases.
The associated analytic signal is:
- $$x_+(t) = x_{\rm U+}(t) + x_{\rm T+}(t) + x_{\rm O+}(t) = A_{\rm U}\cdot {\rm e}^{\hspace{0.05cm}{\rm j}\hspace{0.05cm}\cdot \hspace{0.05cm}(2\pi \hspace{0.05cm}\cdot \hspace{0.05cm}f_{\rm U}\hspace{0.05cm}\cdot \hspace{0.05cm}t- \varphi_{\rm U})} \hspace{0.1cm}+ \hspace{0.1cm}A_{\rm T}\cdot {\rm e}^{\hspace{0.05cm}{\rm j}\hspace{0.05cm}\cdot \hspace{0.05cm}(2\pi \hspace{0.05cm}\cdot \hspace{0.05cm}f_{\rm T}\hspace{0.05cm}\cdot \hspace{0.05cm}t- \varphi_{\rm T})} \hspace{0.1cm}+\hspace{0.1cm} A_{\rm O}\cdot {\rm e}^{\hspace{0.05cm}{\rm j}\hspace{0.05cm}\cdot \hspace{0.05cm}(2\pi \hspace{0.05cm}\cdot \hspace{0.05cm}f_{\rm O}\hspace{0.05cm}\cdot \hspace{0.05cm}t- \varphi_{\rm O})}. $$
$\text{Example 3:}$ Shown the constellation arises i.e. in the Double-sideband Amplitude Modulation (with carrier) of the message signal $x_{\rm N}(t) = A_{\rm N}\cdot \cos\left(2\pi f_{\rm N}\cdot t- \varphi_{\rm N}\right)$ with the carrier signal $x_{\rm T}(t) = A_{\rm T}\cdot \cos\left(2\pi f_{\rm T}\cdot t - \varphi_{\rm T}\right)$. This is discussed frequently in the Exercises.
There are some limitations to the program parameters in this approach:
- For the frequencies, it always applies $f_{\rm O} = f_{\rm T} + f_{\rm N}$ and $f_{\rm U} = f_{\rm T} - f_{\rm N}$.
- Without distortions the amplitude of the sidebands are $A_{\rm O}= A_{\rm U}= A_{\rm N}/2$.
- The respective phase relationships can be seen in the following graphic.
Exercises
- First select the task number.
- A task description is displayed.
- Parameter values are adjusted.
- Solution after pressing „Hide solition”.
The number „0” will reset the program and output a text with further explanation of the applet.
In the following, $\rm Green$ denotes the lower sideband ⇒ $\big (A_{\rm U}, f_{\rm U}, \varphi_{\rm U}\big )$,
$\rm Red$ the carrier ⇒ $\big (A_{\rm T}, f_{\rm T}, \varphi_{\rm T}\big )$ and
$\rm Blue$ the upper sideband ⇒ $\big (A_{\rm O}, f_{\rm O}, \varphi_{\rm O}\big )$.
(1) Consider and interpret the analytic signal $x_+(t)$ for $\text{Red:} \hspace{0.15cm} A_{\rm T} = 1.5\ \text{V}, \ f_{\rm T} = 50 \ \text{kHz}, \ \varphi_{\rm T} = 0^\circ$, $A_{\rm U} = A_{\rm O} = 0$.
- Which signal values $x_+(t)$ result for $t = 0$, $t = 5 \ \rm µ s$ and $t = 20 \ \rm µ s$? What are the corresponding signal values for $x(t)$?
- For a cosine signal, let $x_+(t= 0) = A_{\rm T} = 1.5\ \text{V}$. Then $x_+(t)$ rotates in a mathematically positive direction (one revolution per period $T_0 = 1/f_{\rm T}$):
- $x_+(t= 20 \ {\rm µ s}) = x_+(t= 0) = 1.5\ \text{V}\hspace{0.3cm}\Rightarrow\hspace{0.3cm}x(t= 20 \ {\rm µ s}) = 1.5\ \text{V,}$
- $x_+(t= 5 \ {\rm µ s}) = {\rm j} \cdot 1.5\ \text{V}\hspace{0.3cm}\Rightarrow\hspace{0.3cm}x(t= 5 \ {\rm µ s}) = {\rm Re}[x_+(t= 5 \ {\rm µ s})] = 0$.
(2) How do the ratios change for $\text{Red:} \hspace{0.15cm} A_{\rm T} = 1.0\ \text{V}, \ f_{\rm T} = 100 \ \text{kHz}, \ \varphi_{\rm T} = 90^\circ$?
- The signal $x(t)$ is now a sine signal with a smaller amplitude. The analytic signal now starts because of $\varphi_{\rm T} = 90^\circ$ ⇒ $\phi_{\rm T} = -90^\circ$ at $x_+(t= 0) = -{\rm j} \cdot A_{\rm T}$.
After that, $x_+(t)$ rotates again in a mathematically positive direction, but twice as fast because of $T_0 = 10 \ \rm µ s$ as in $\rm (1)$.
- The signal $x(t)$ is now a sine signal with a smaller amplitude. The analytic signal now starts because of $\varphi_{\rm T} = 90^\circ$ ⇒ $\phi_{\rm T} = -90^\circ$ at $x_+(t= 0) = -{\rm j} \cdot A_{\rm T}$.
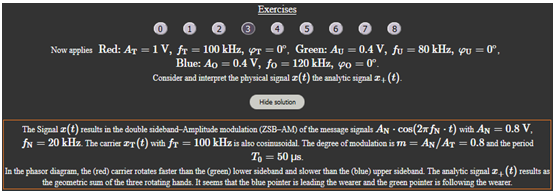
(3) Now $\text{Red:} \hspace{0.15cm} A_{\rm T} = 1\ \text{V}, \ f_{\rm T} = 100 \ \text{kHz}, \ \varphi_{\rm T} = 0^\circ$, $\text{Green:} \hspace{0.15cm} A_{\rm U} = 0.4\ \text{V}, \ f_{\rm U} = 80 \ \text{kHz}, \ \varphi_{\rm U} = 0^\circ$, $\text{Blue:} \hspace{0.15cm} A_{\rm O} = 0.4\ \text{V}, \ f_{\rm O} = 120 \ \text{kHz}, \ \varphi_{\rm O} = 0^\circ$.
- Consider and interpret the physical signal $x(t)$ and the analytic signal $x_+(t)$.
- The Signal $x(t)$ results in the Double-sideband Amplitude Modulation (DSB–AM) of the message signal $A_{\rm N}\cdot \cos\left(2\pi f_{\rm N}\cdot t\right)$ with $A_{\rm N} = 0.8\ \text{V}$, $f_{\rm N} = 20\ \text{kHz}$. The carrier $x_{\rm T}(t)$ with $f_{\rm T} = 100\ \text{kHz}$ is also cosinusoidal. The degree of modulation is $m = A_{\rm N}/A_{\rm T} = 0.8$ and the period $T_{\rm 0} = 50\ \text{µs}$.
- In the phase diagram, the (red) carrier rotates faster than the (green) lower sideband and slower than the (blue) upper sideband. The analytic signal $x_+(t)$ results as the geometric sum of the three rotating pointers. It seems that the blue pointer is leading the carrier and the green pointer is following the carrier.
(4) The settings of task (3) still apply. Which signal values are obtained at $t=0$, $t=2.5 \ \rm µ s$, $t= 5 \ \rm µ s$ and $t=10 \ \rm µ s$?
- At time $t=0$, all pointers are in the direction of the real axis, so that $x(t=0) = {\rm Re}\big [x+(t= 0)\big] = A_{\rm U} + A_{\rm T} + A_{\rm O} = 1.8\ \text{V}$.
- Until the time $t=2.5 \ \rm µ s$, the red carrier has rotated by $90^\circ$, the blue one by $108^\circ$ and the green one by $72^\circ$. We have $x(t=2.5 \ \rm µ s) = {\rm Re}\big [x_+(t= 2.5 \ \rm µ s)\big] = 0$, because now the pointer group points in the direction of the imaginary axis. The other sought signal values are $x(t=5 \ \rm µ s) = {\rm Re}\big [x_+(t= 5 \ \rm µ s)\big] = -1.647\ \text{V}$ and $x(t=10 \ \rm µ s) = {\rm Re}\big [x_+(t= 10 \ \rm µ s)\big] = 1.247\ \text{V}$.
- For $x_+(t)$ a spiral shape results, alternating with a smaller radius and then with a larger radius.
(5) How should the phase parameters $\varphi_{\rm T}$, $\varphi_{\rm U}$ and $\varphi_{\rm O}$ be set if both the carrier $x_{\rm T}(t)$ and the message signal $x_{\rm N}(t)$ are sinusoidal?
- The parameter selection $\varphi_{\rm T} = \varphi_{\rm U} = \varphi_{\rm O}=90^\circ$ describes the signals $x_{\rm T}(t) = A_{\rm T}\cdot \sin\left(2\pi f_{\rm T}\cdot t\right)$ and $x_{\rm N}(t) = A_{\rm N}\cdot \cos\left(2\pi f_{\rm N}\cdot t\right)$. If, in addition, the message $x_{\rm N}(t)$ is sinusoidal, then $\varphi_{\rm O}=\varphi_{\rm T} - 90^\circ = 0$ and $\varphi_{\rm U}=\varphi_{\rm T} + 90^\circ = 180^\circ$ must be set.
(6) The settings of task (3) apply except $A_{\rm T} = 0.6\ \text{V}$. Which modulation method is described here?
- What are the consequences of this? What changes with $A_{\rm T} = 0$?
- It is a Double-sideband Amplitude Modulation (DSB–AM with carrier) with the modulation degree $m=0.8/0.6 = 1.333$. For $m > 1$, however, Synchronous Demodulation is required. Envelope Detection no longer works. One reason for this is that now the zero crossings of $x(t)$ are no longer equidistant from $5\ \rm µ s$ ⇒ additional phase modulation.
- With $A_{\rm T} = 0$ ⇒ $m \to \infty$ results in a DSB–AM without carrier. For this, one also needs coherent demodulation.
(7) Now let $\text{Red:} \hspace{0.15cm} A_{\rm T} = 1\ \text{V}, \ f_{\rm T} = 100 \ \text{kHz}, \ \varphi_{\rm T} = 0^\circ$, $\text{Green:} \hspace{0.15cm} A_{\rm U} = 0$, $\text{Blue:} \hspace{0.15cm} A_{\rm O} = 0.8\ \text{V}, \ f_{\rm O} = 120 \ \text{kHz}, \ \varphi_{\rm O} = 90^\circ$.
- Which constellation is described here? Which figure is given for the equivalent low-pass signal $x_{\rm TP}(t)$? ⇒ „locus”?
What changes with $A_{\rm U} = 0.8\ \text{V}$ and $A_{\rm O} = 0$?
- In both cases, it is a Single-sideband Amplitude Modulation (SSB–AM) with the modulation degree $\mu = 0.8$ (in SSB we denote the degree of modulation with $\mu$ instead of $m$). The carrier signal is cosinusoidal and the message signal is sinusoidal. The equivalent low-pass signal $x_{\rm TP}(t)$ has a circular course in the complex plane.
- $A_{\rm O} = 0.8\ \text{V}$, $A_{\rm U} = 0$ is an OSB modulation. The green pointer is missing and the blue pointer rotates faster compared to the red carrier.
- $A_{\rm U} = 0.8\ \text{V}$, $A_{\rm O} = 0$ is a USB modulation. The blue pointer is missing and the green pointer rotates slower compared to the red carrier.
(8) Now let $\text{Red:} \hspace{0.05cm} A_{\rm T} = 1\ \text{V}, \ f_{\rm T} = 100 \ \text{kHz}, \ \varphi_{\rm T} = 0^\circ$, $\text{Green:} \hspace{0.05cm} A_{\rm U} = 0.4\ \text{V}, \ f_{\rm U} = 80 \ \text{kHz}, \ \varphi_{\rm U} = -90^\circ$, $\text{Blue:} \hspace{0.05cm} A_{\rm O} = 0.2\ \text{V}, \ f_{\rm O} = 120 \ \text{kHz}, \ \varphi_{\rm O} = +90^\circ$.
- Which constellation could be described here? Which shape results for the equivalent lowpass signal $x_{\rm TP}(t)$?
- It could be a DSB–AM of a sinusoidal signal with cosinusoidal carrier and modulation degree $m=0.8$, in which the upper sideband is attenuated by a factor of 2. The equivalent lowpass signal $x_{\rm TP}(t)$ has an elliptical trace in the complex plane.
Applet Manual
- The red parameters $(A_{\rm T}, \ f_{\rm T}, \ \varphi_{\rm T})$ and the red pointer mark the Carrier
(German: Träger). - The green parameters $(A_{\rm U}, \ f_{\rm U} < f_{\rm T}, \ \varphi_{\rm U})$ mark the Lower sideband
(German: Unteres Seitenband). - The blue parameters $(A_{\rm O}, \ f_{\rm O} > f_{\rm T}, \ \varphi_{\rm O})$ mark the Upper sideband
(German: Oberes Seitenband). - All pointers rotate in a mathematically positive direction (counterclockwise).
Meaning of the letters in the adjacent graphic:
(A) Plot of the analytic signal $x_{\rm +}(t)$
(B) Plot of the physical signal $x(t)$
(C) Parameter input via slider: amplitudes, frequencies, phase values
(D) Control elements: Start – Step – Pause/Continue – Reset
(E) Speed of animation: „Speed” ⇒ Values: 1, 2, 3
(F) „Trace” ⇒ On or Off, trace of complex signal values $x_{\rm +}(t)$
(G) Numerical output of the time $t$ and the signal values ${\rm Re}[x_{\rm +}(t)] = x(t)$ and ${\rm Im}[x_{\rm +}(t)]$
(H) Variations for the graphical representation
$\hspace{1.5cm}$Zoom–Functions „$+$” (Enlarge), „$-$” (Decrease) and $\rm o$ (Reset to default)
$\hspace{1.5cm}$Move with „$\leftarrow$” (Section to the left, ordinate to the right), „$\uparrow$” „$\downarrow$” and „$\rightarrow$”
(I) Experiment section: Task selection and task
(J) Experiment section: solution
About the Authors
This interactive calculation was designed and realized at the Lehrstuhl für Nachrichtentechnik of the Technical University of Munich .
- The original version was created in 2005 by Ji Li as part of her Diploma thesis using „FlashMX–Actionscript” (Supervisor: Günter Söder).
- In 2018 this Applet was redesigned and updated to „HTML5” by Xiaohan Liu as part of her Bachelor's thesis (Supervisor: Tasnád Kernetzky).
